Using CRM Analytics
1. Using CRM Analytics
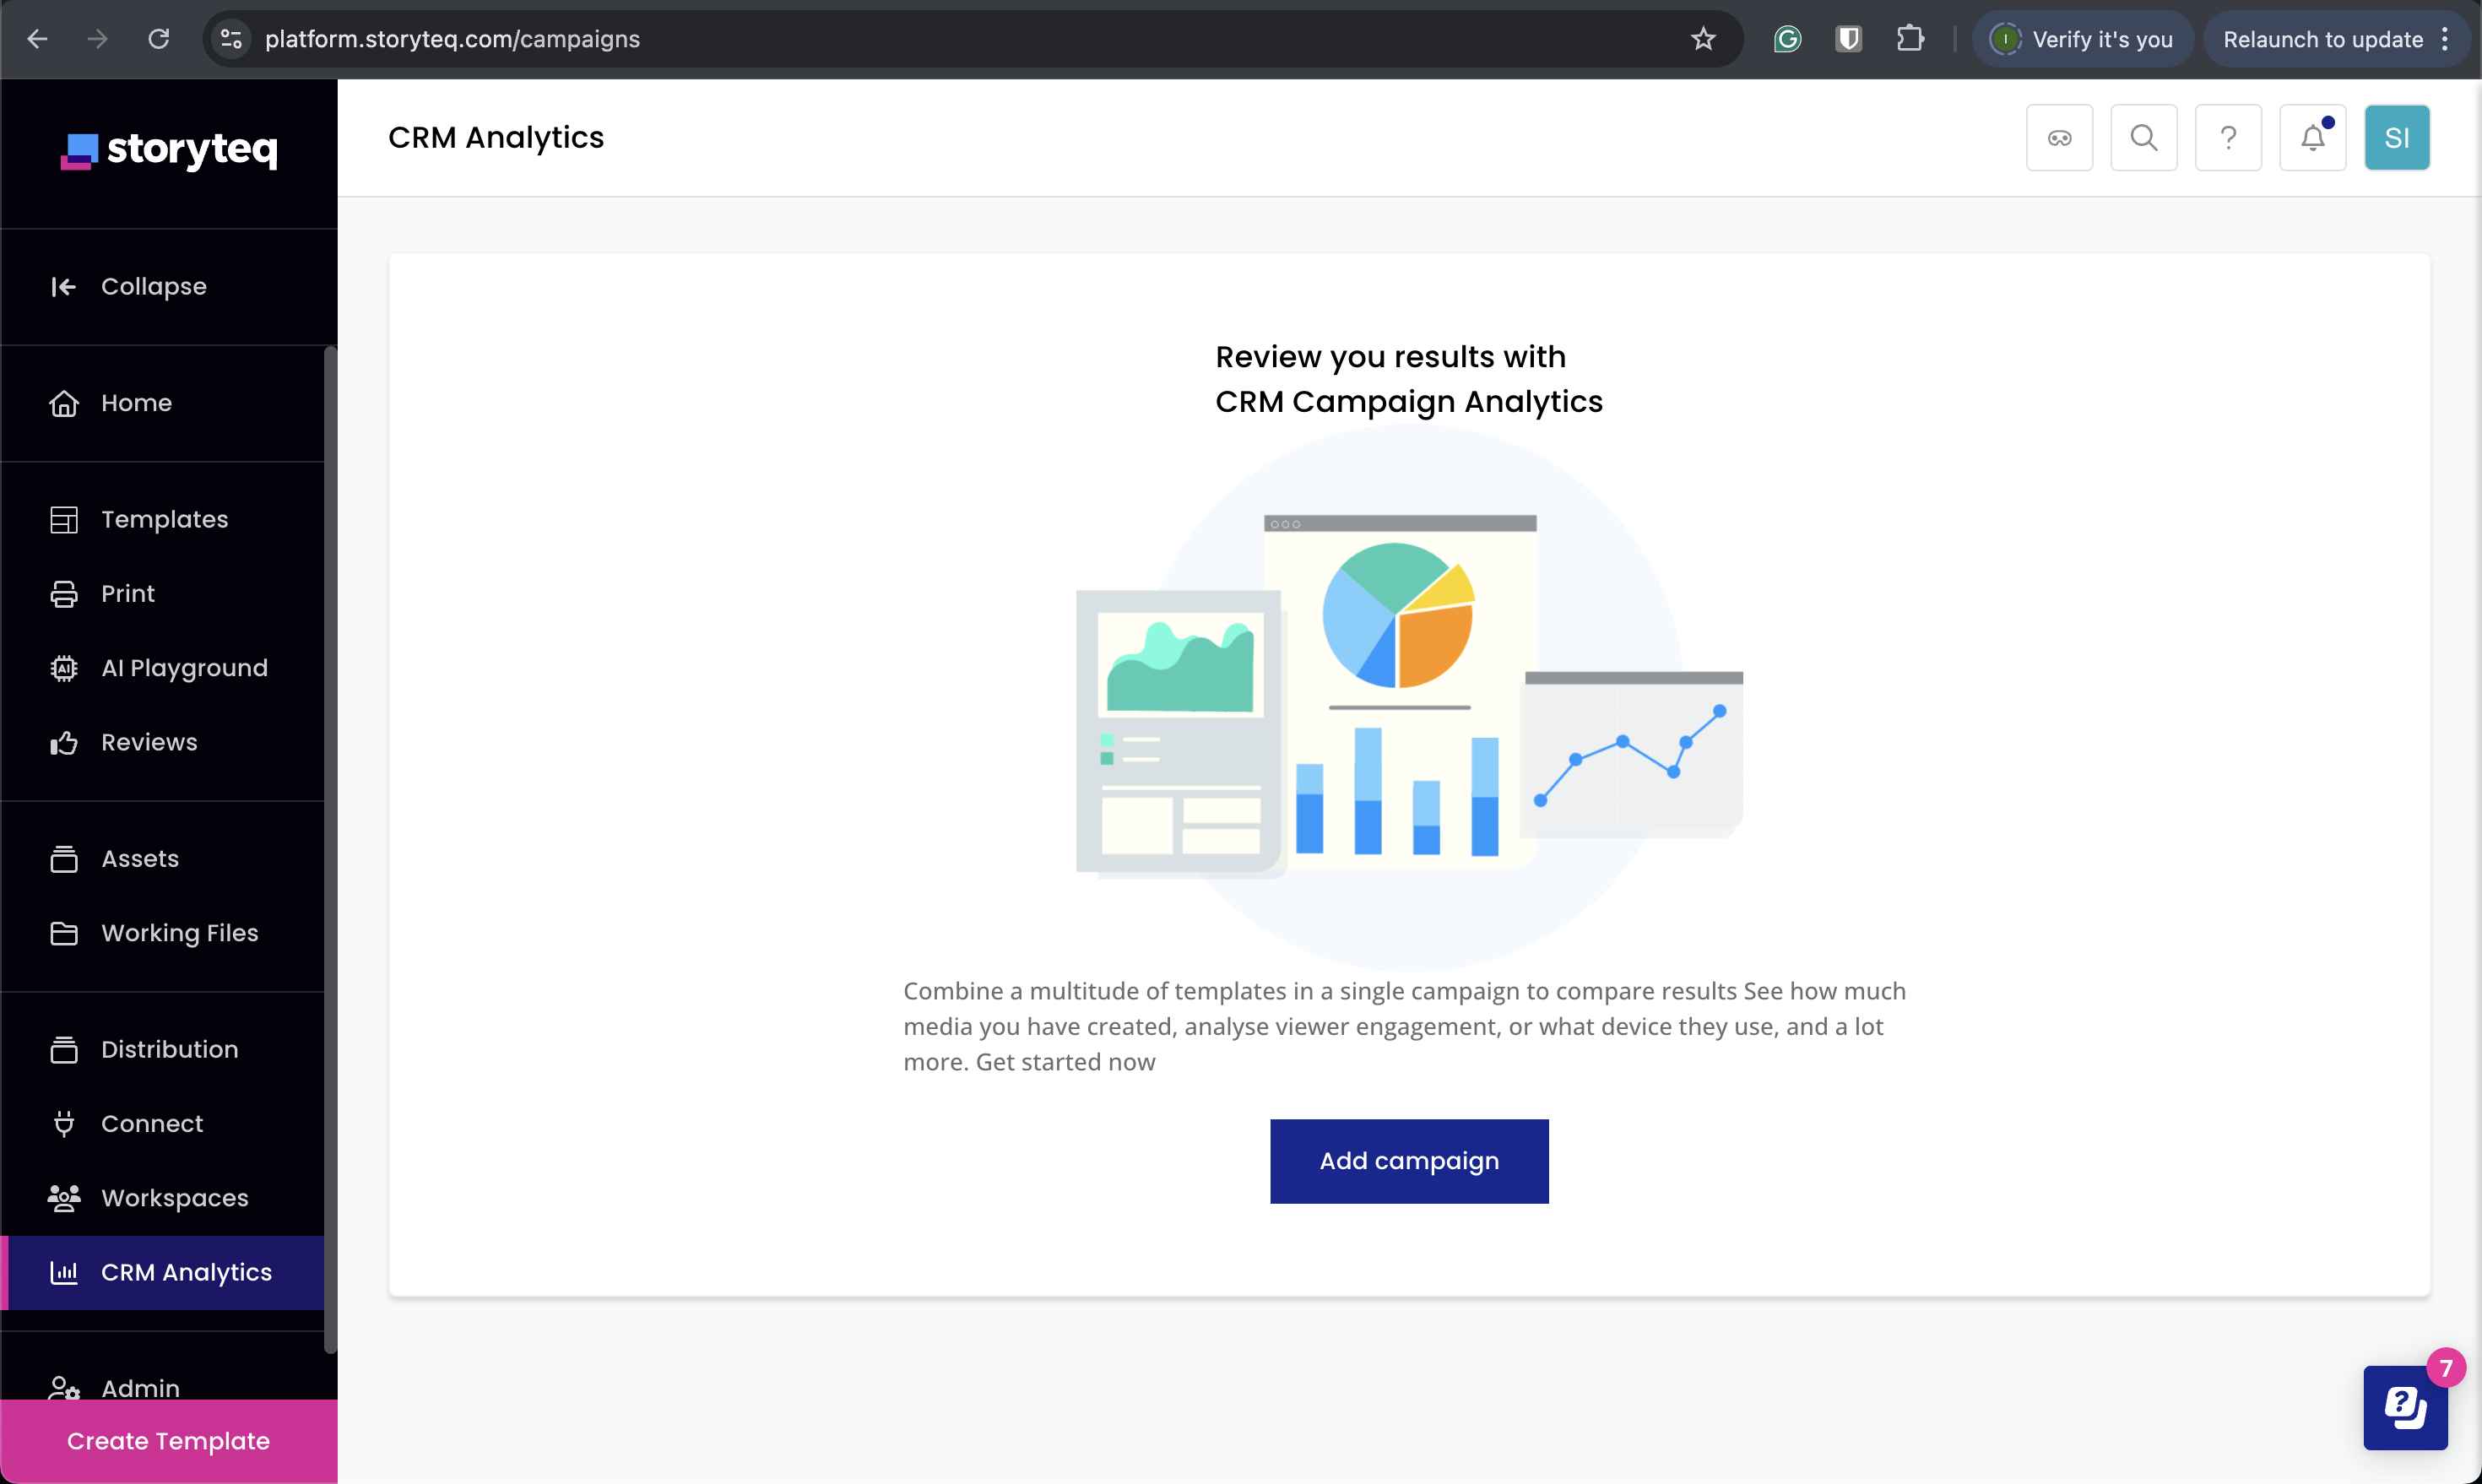
If you are a Storyteq client who uses our CRM Solution, the Storyteq Platform allows you to track and analyze the progress of your CRM Campaign through the CRM Analytics page. This page provides you with a number of graphical widgets, giving you an idea of how your campaign is performing. By default, the date range of the visible data is the last 7 days. Use the date picker in the top-right corner to change the date range.
2. The Widgets
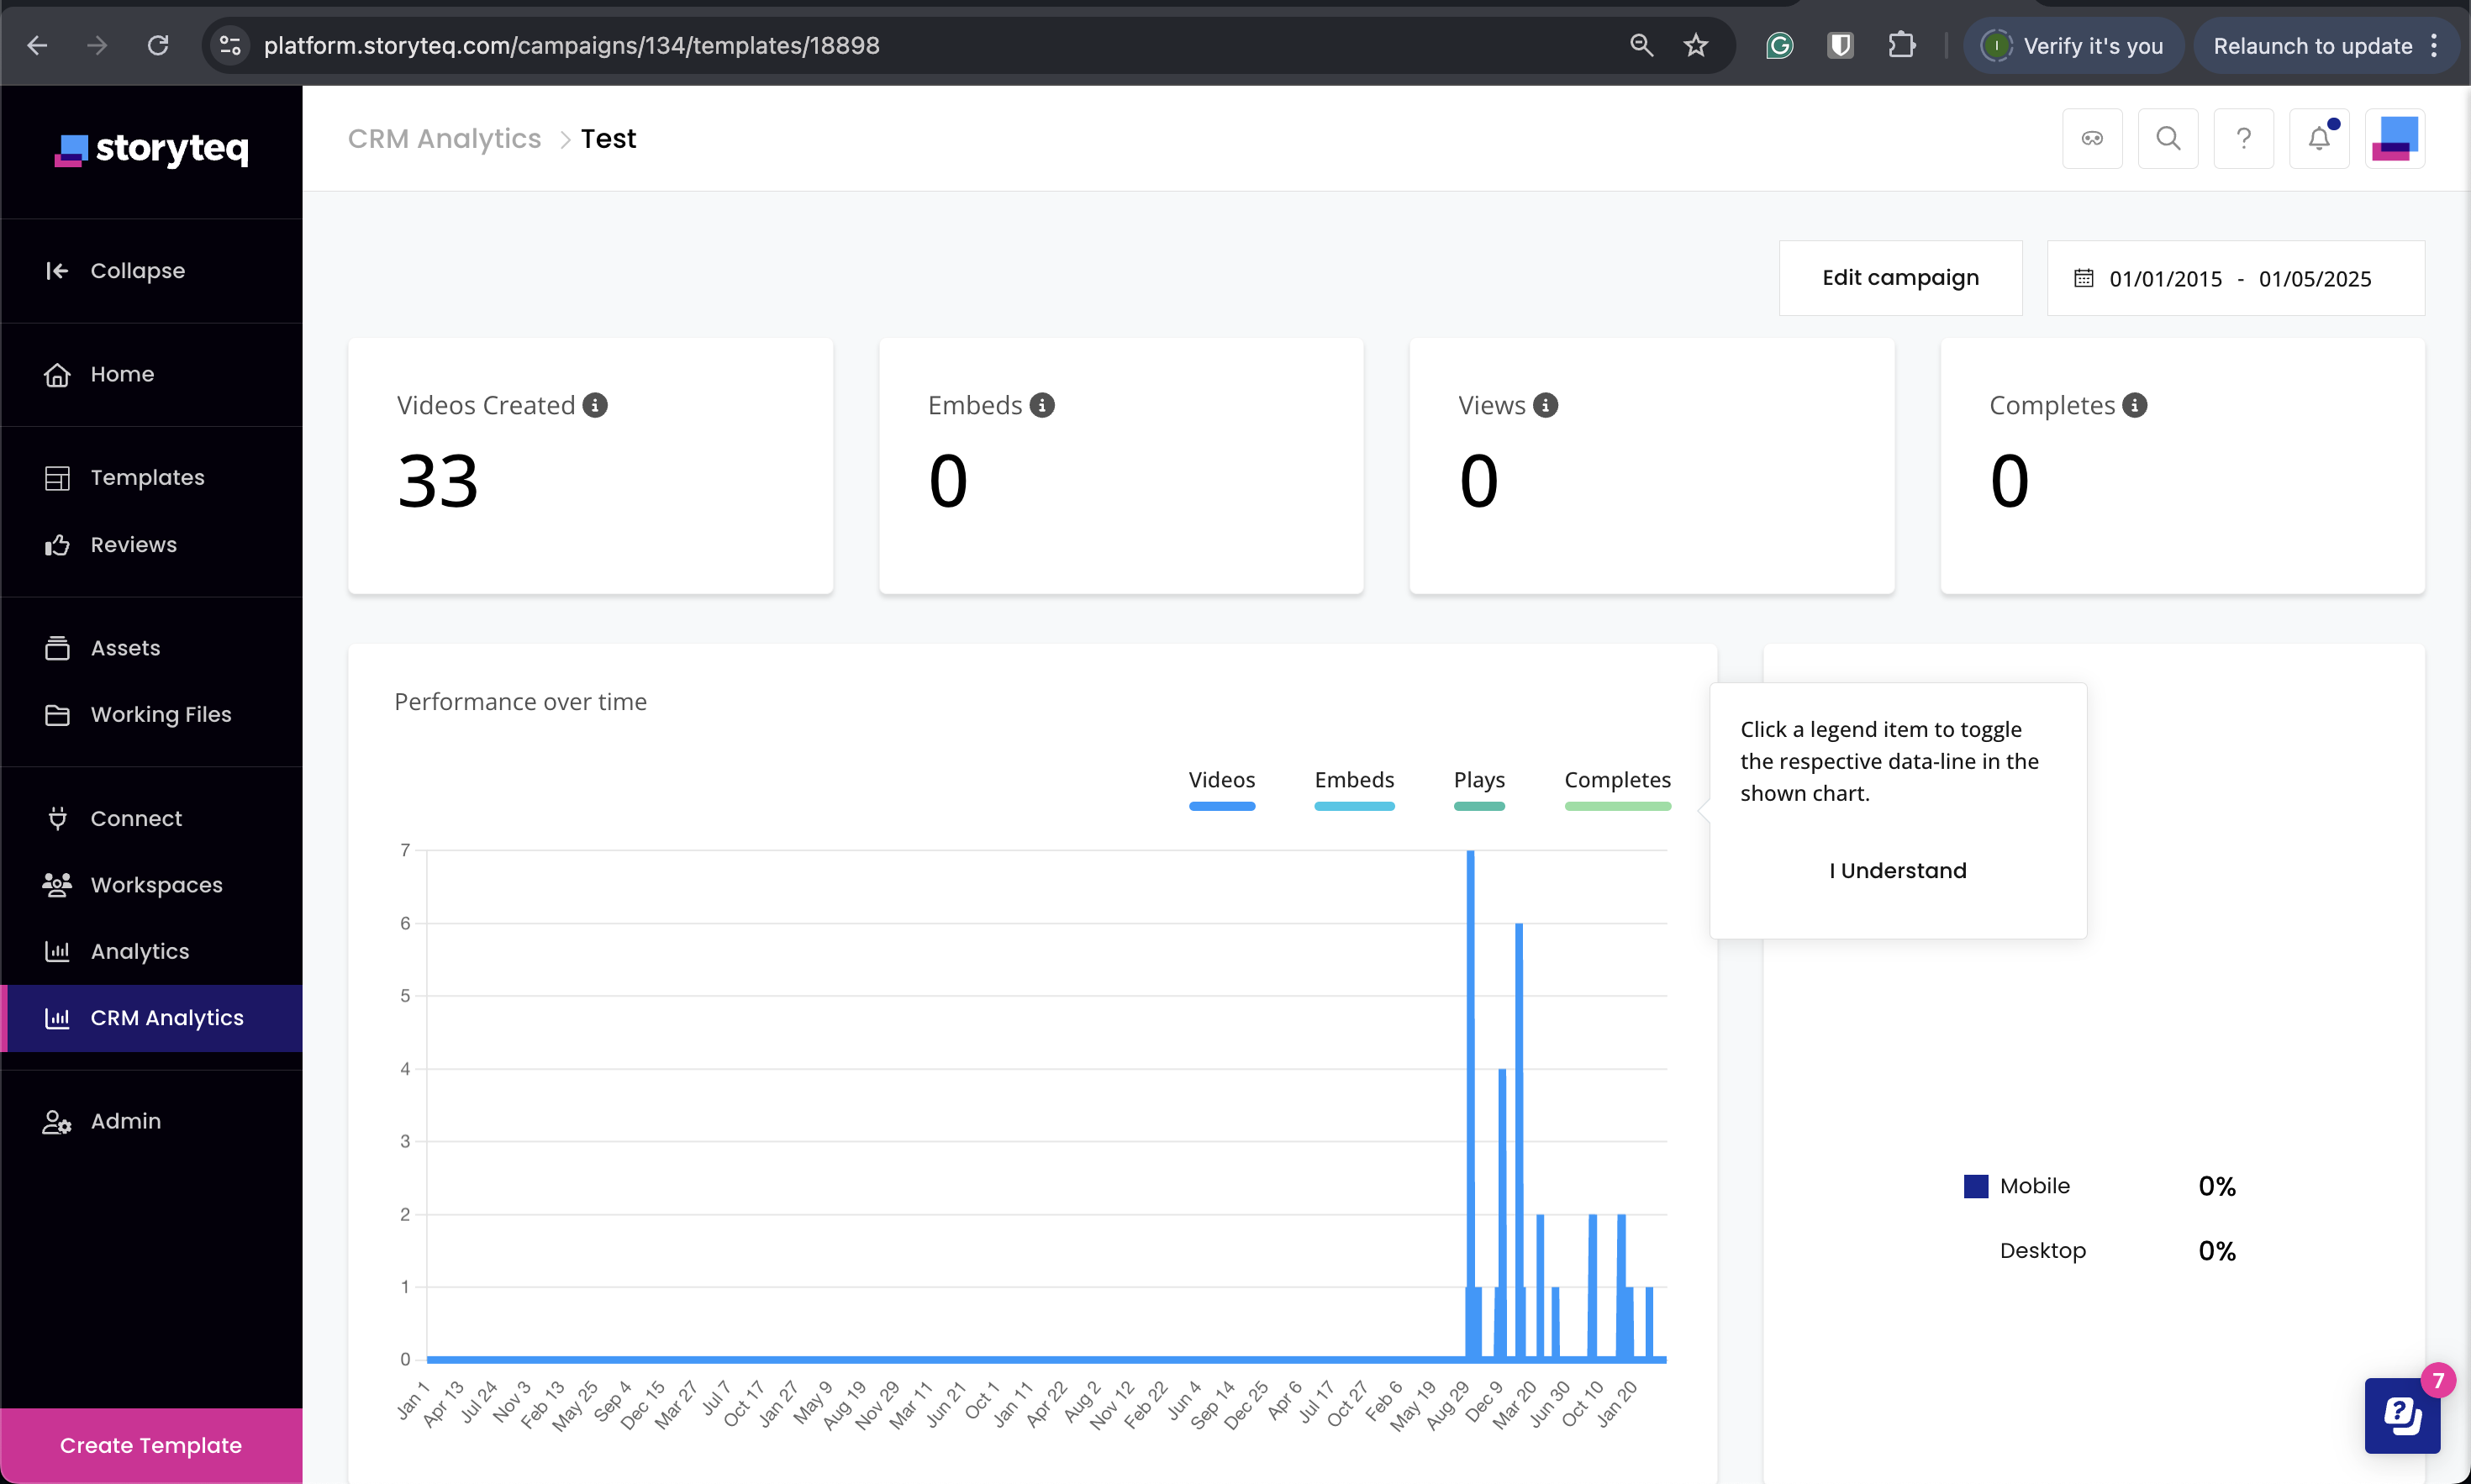
2.1 The Quick Numbers Widgets
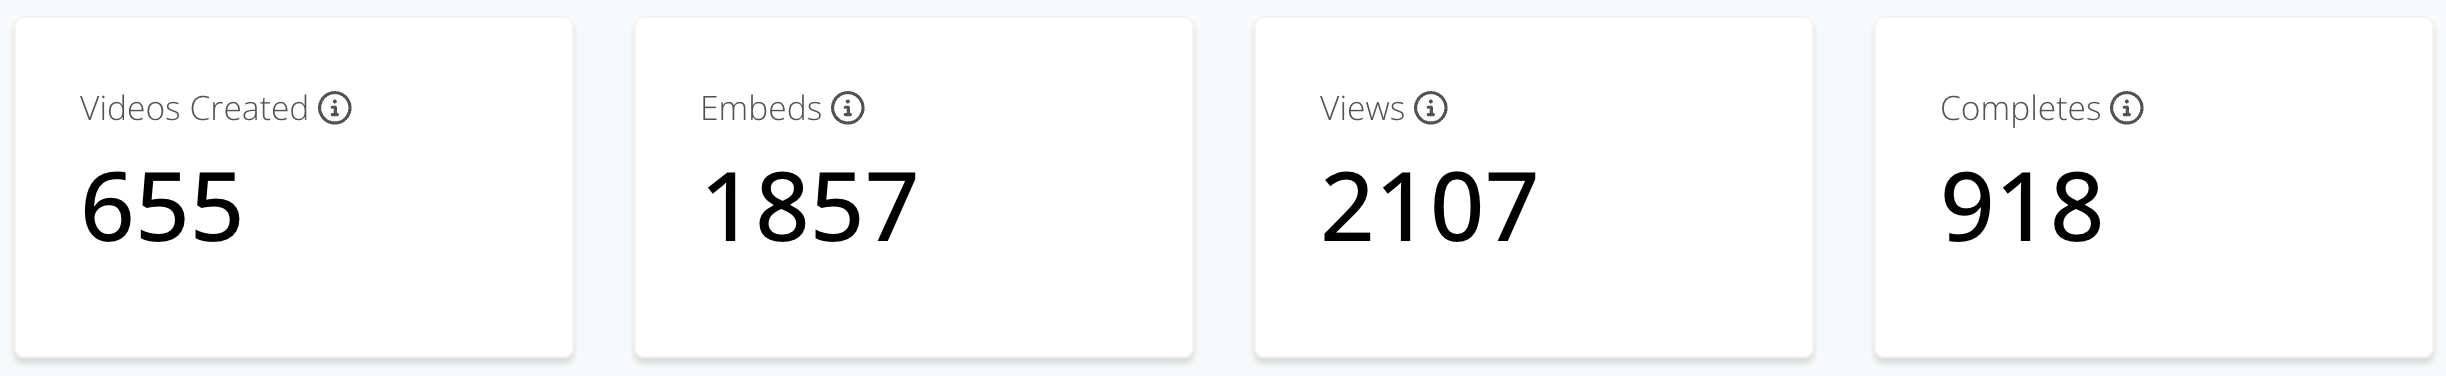
The widgets at the start of your page show you how your campaign is performing through it's funnel. It follows the following stages:
Videos Created
The number of videos that have been created by the Storyteq Platform (Note: Before being embedded).Embeds
The number of created videos that have been embedded on the landing page of this campaign.Views
The number of times an embedded video has started playing (Note: this includes multiple plays per viewer).Completes
The number of embedded videos that have been watched until the end of the video.
2.2 The Performance- and Devices charts
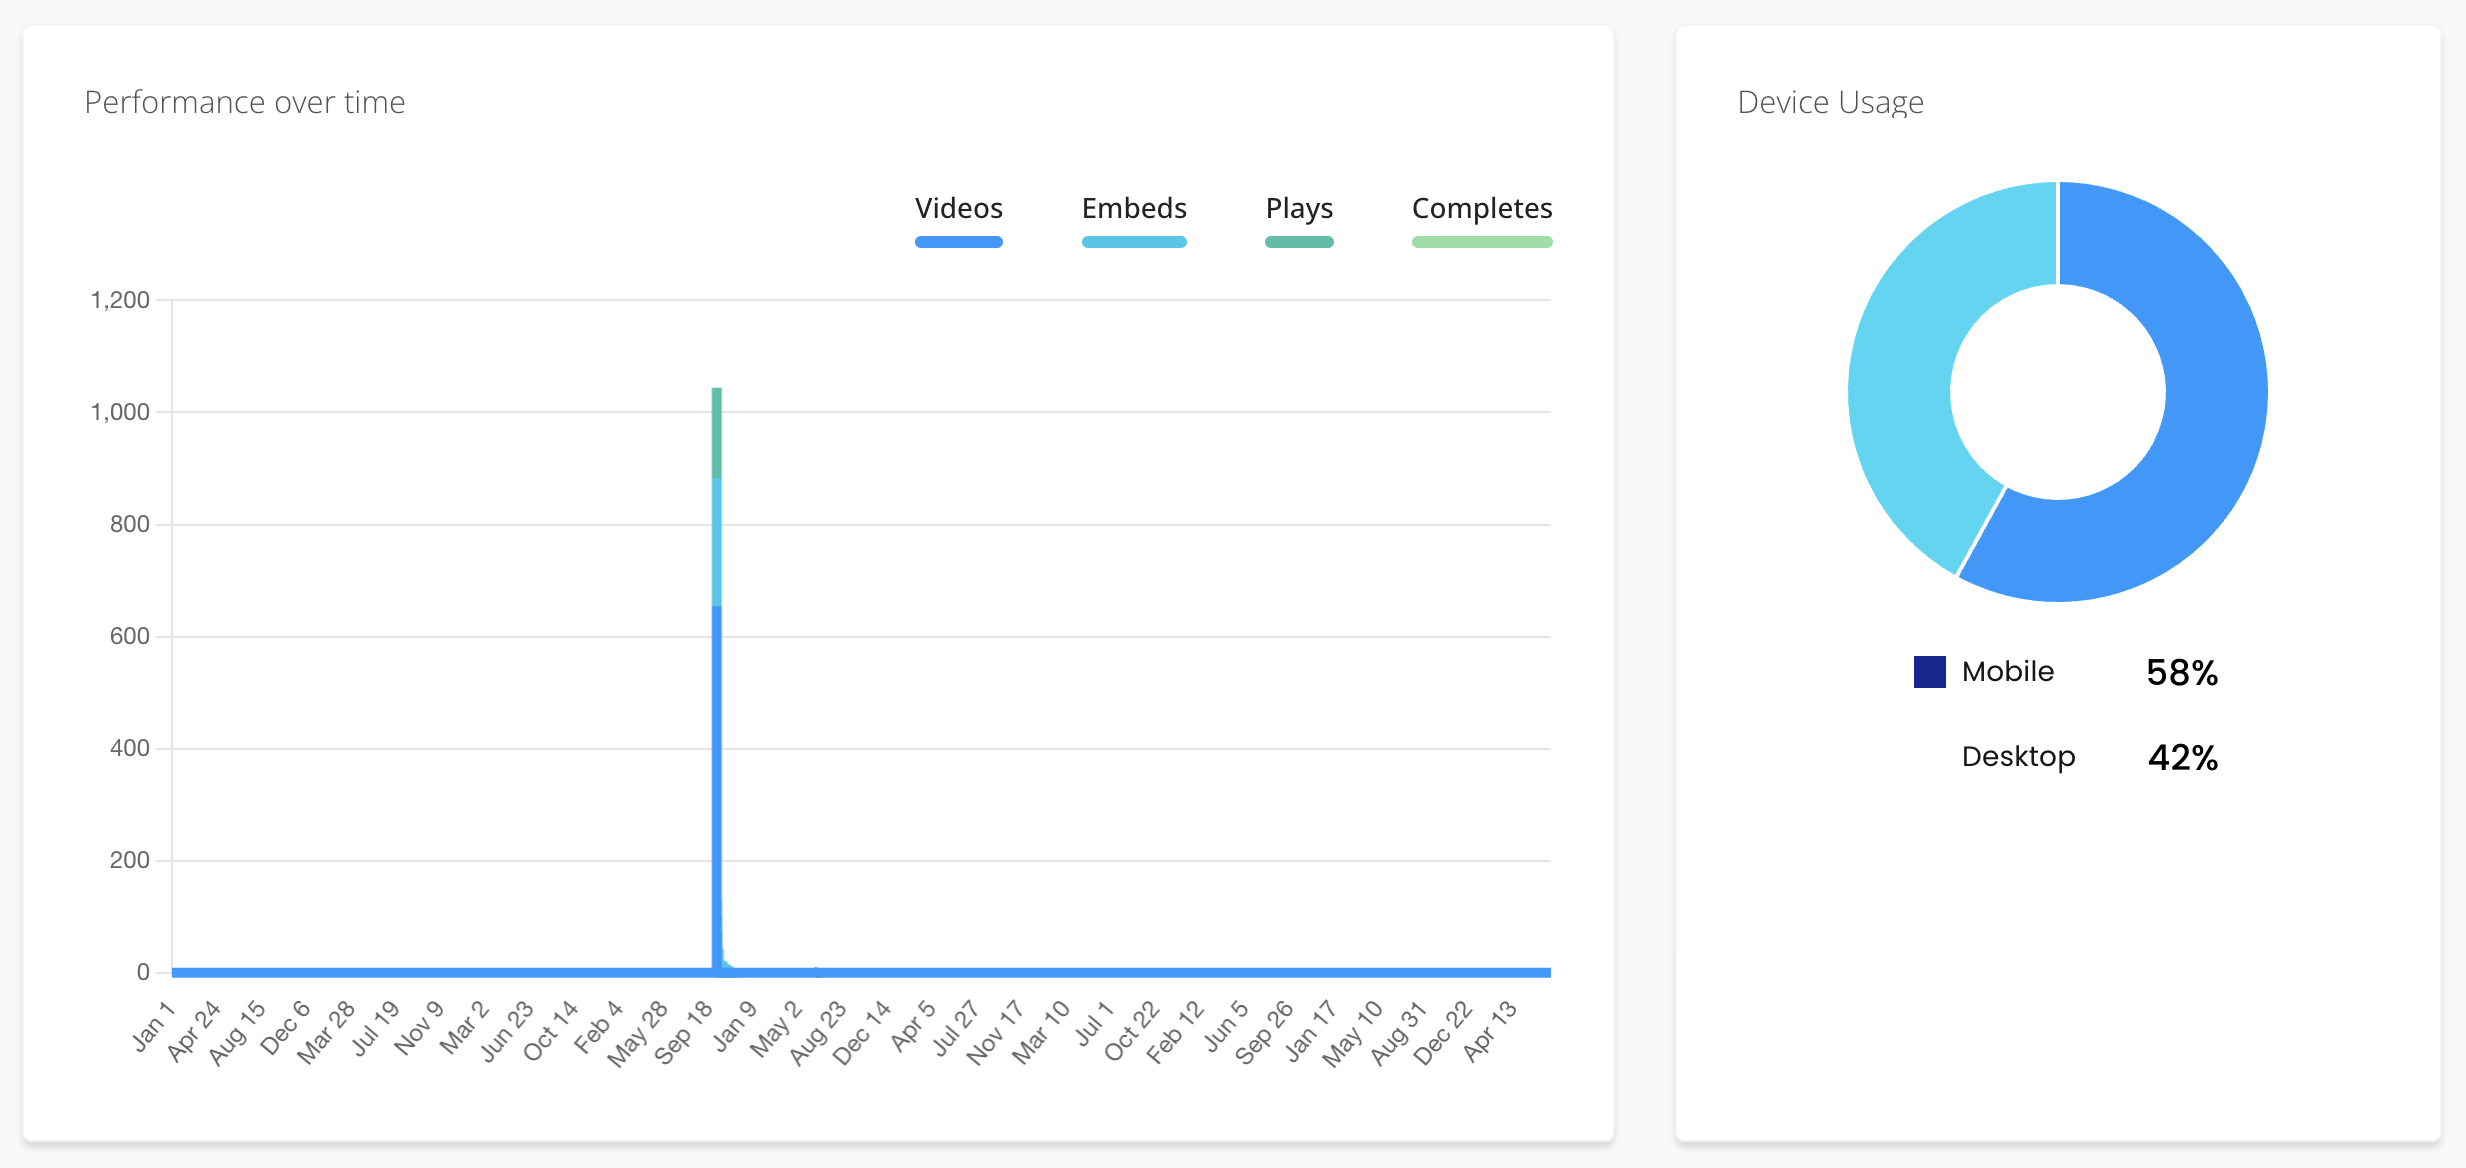
Below the quick numbers, you will find a graph showing these numbers over time (your set date range). Use the legend to toggle the KPIs. The chart enables you to get an idea of how your campaign is performing over time and where big changes have occurred in your audience's viewing behavior.
To the right of the performance chart, you will find the Devices doughnut chart. This graph shows you on what type of devices your videos are being watched.
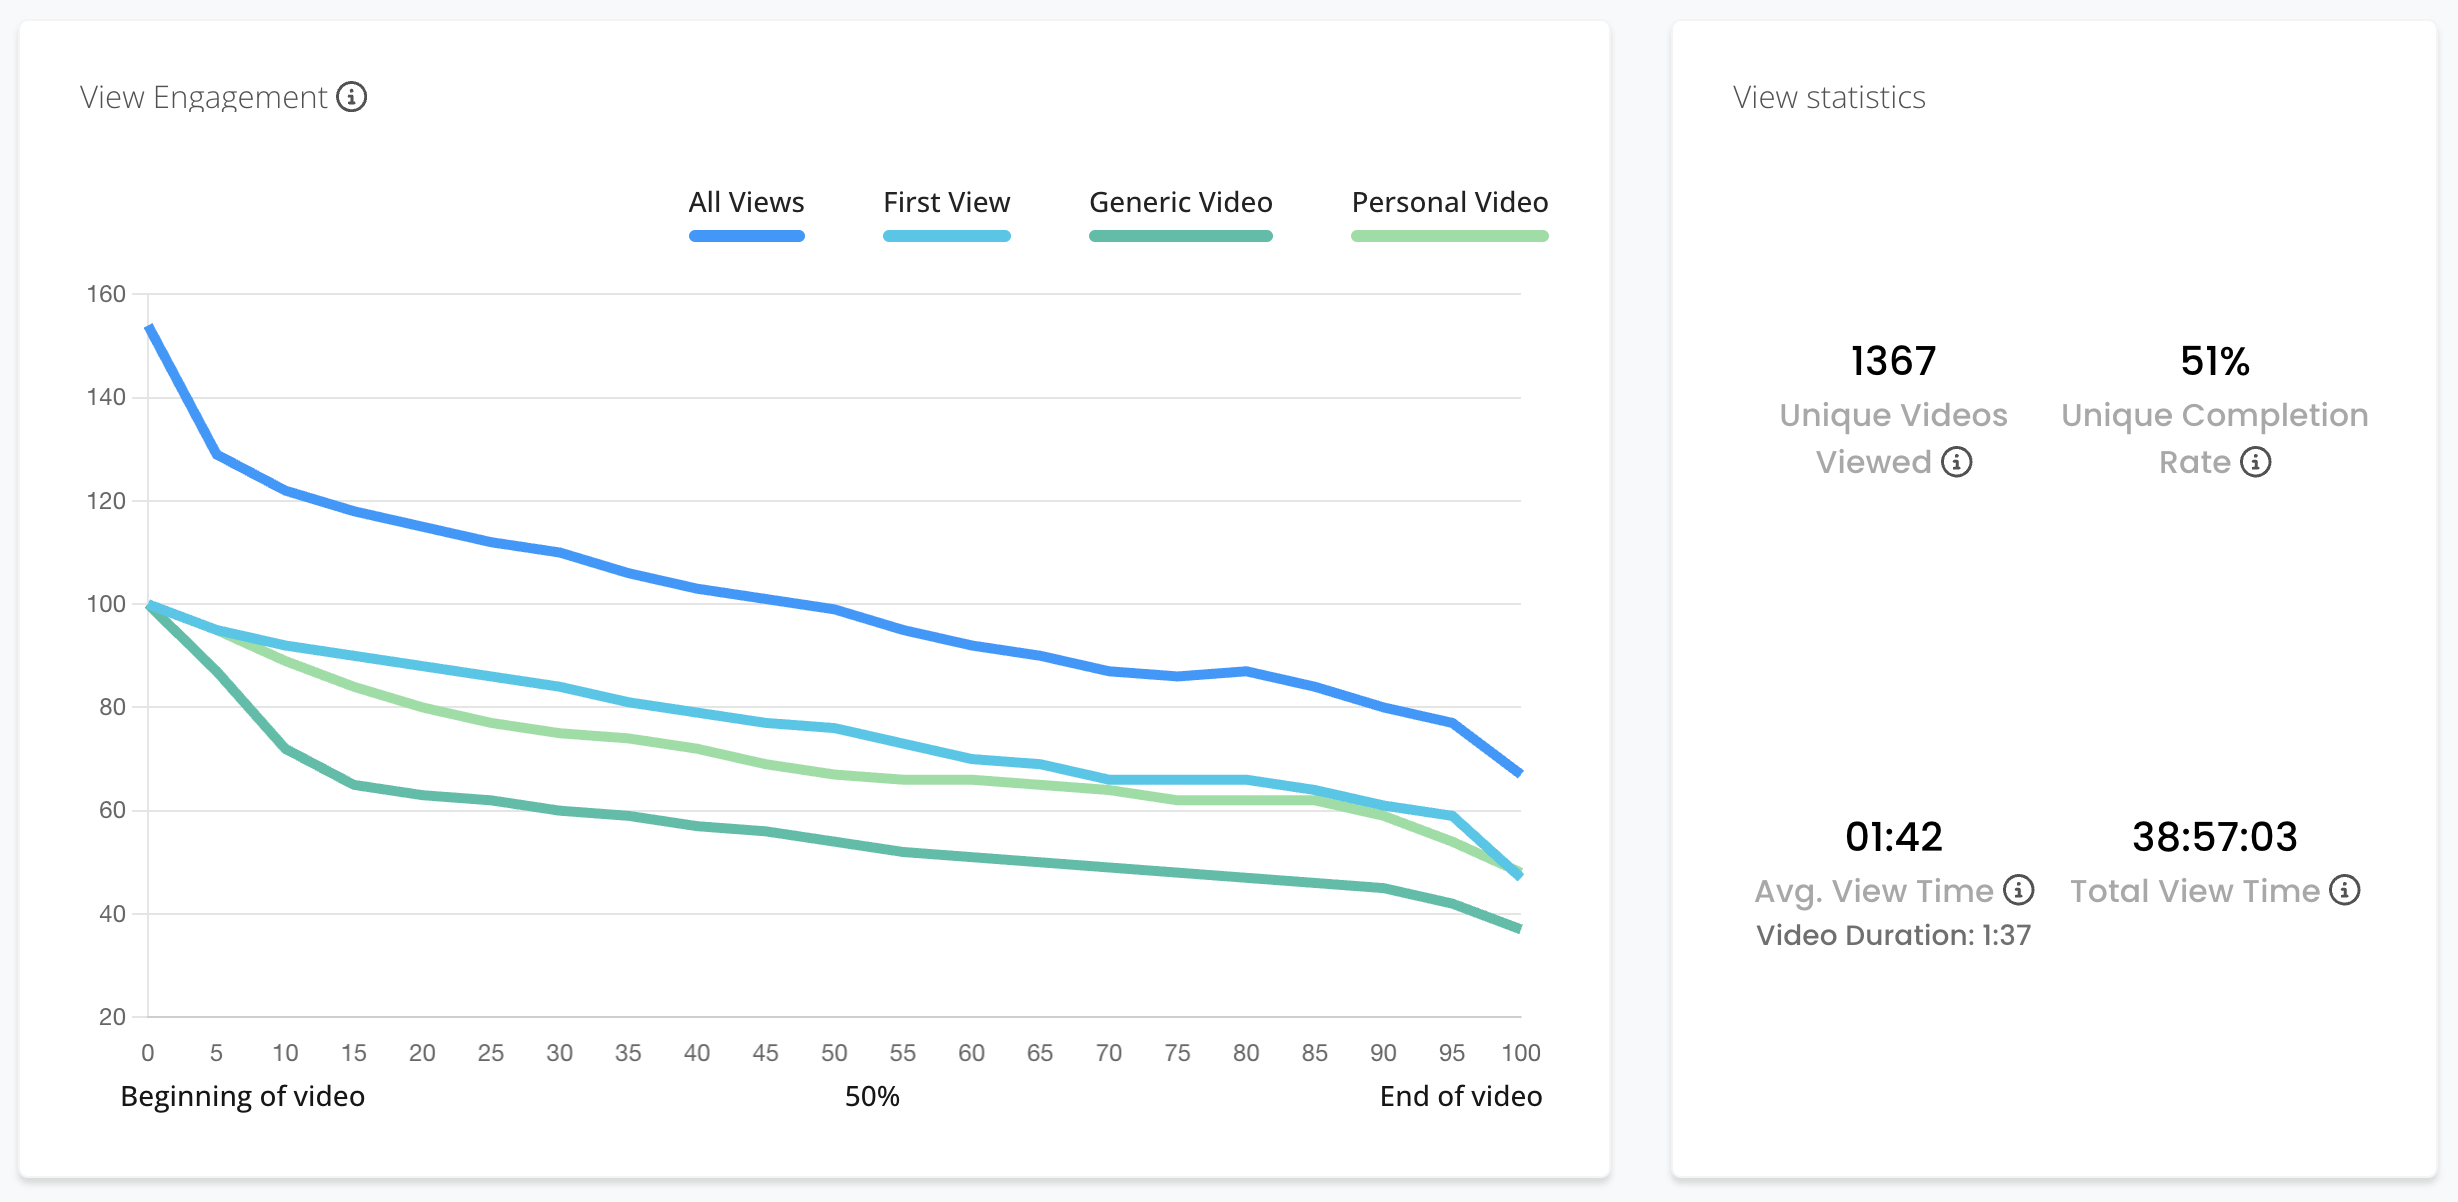
2.3 View Engagement and Other Statistics
As final analytics, the platform shows you a graph that shows the viewer's engagement. This graph allows you to track the engagement of your created videos. This can help identify where viewers drop off or which parts see the most replays. If parts get watched more than once, engagement will be higher than 100 percent.
To the right are a few different numbers, giving you an idea of how the video is watched. The following KPI's are listed:
Unique Videos Played
The number of unique videos that have been viewed one or more times.Completion Rate
The percentage of watched videos that have been viewed until the end.Average Time Watched
The average time that a user has spent watching the video created for him or her.Total Time Watched
The total time that your video content has been watched in Hours : Minutes: Seconds